Inventory, Even in the Woods

I’m an active member of a local SCA branch. The SCA is a registered non-profit and its branches are much like local chapters, so that non-profit status is inherited. Most SCA branches own some amount of movable property – kitchen equipment, tents & pavilions, wall hangings & other decor, and maybe even a trailer to store and haul it all. Where there’s property, there’s an Inventory!

Taking Inventory the Old Way

In 2019, I attended a “taking inventory” session, where the branch’s property inventory records are compared against the actual items, and the records are adjusted to match (and in some cases, items that went into the wrong numbered box are put where they belong). At that time, the inventory records were captured in a spreadsheet file, with one sheet for every box, plus some sheets for “loose items” and items that are being stored by individuals for reasons of easy access or because they can’t be safely stored in the trailer.

One individual was designated to amend the spreadsheet sheets on the fly, in spite of having paper lists printed out for every box or location. It was torturous, and the general mood was that of rushing to get it done because of that bottleneck. I started marking down notes on the printed sheets, and I also took a bunch of photos (none existed).

Packing Up the Old Way

A few months later, I participated in an event (that’s what the stuff in the trailer is used for!) and helped out with the task of putting everything back into the right box so it would all fit back into the trailer. That consisted largely of guessing which box might be the right one, and visually examining the printed inventory sheet for it to confirm. If you didn’t guess right the first time, check a different box! It took a long time and was very chaotic.

There’s Gotta Be a Better Way!

After that, I was determined to find a better way to manage the branch’s property. I looked at a few self-hosted options, but none of them really fit – they were all too complicated. And so, I decided that I’d see if I could come up with a simpler web app that would meet my local branch’s specific needs and make both inventory and event pack-out a better experience.

Initially, I figured I would use PHP and MySQL to accomplish this, as I had prior experience with both. However, at one point I decided to follow a tutorial to see if I could learn how to use the Django framework. It took me a minute to grok the structure, but yeah, I got it!

Pandemic Project

I checked in my first git commit of the project on September 10, 2020. By the beginning of October, I was able to generate a full set of nicely formatted PDF documents – a full item listing, a document for each box, and a list of boxes sorted both A-Z and numerically. I exported the data in csv and spreadsheet format for backup purposes. I had also given it a name – Mobiliaire.

In October 2020, I accomplished a bunch of tasks:

  • put a demo version online
  • implement a simple search function
  • started adding support for images
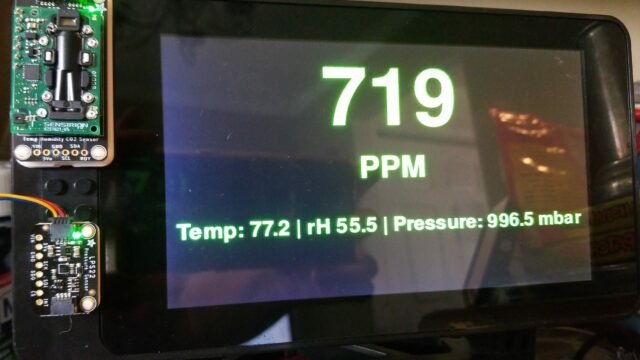
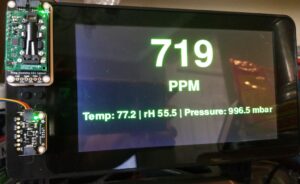
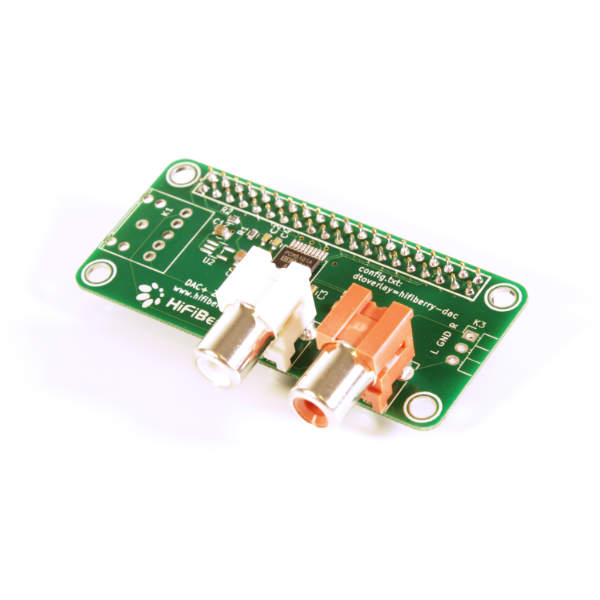
  • started adding support for capturing images using a RaspberryPi + PiCamera
  • Released versions 1.0 and 1.0.1

At that point, I had an app that more-or-less worked, but nowhere to take it. My attention went elsewhere and I didn’t do much else with it until July 2021.

Support for More Cameras

In July 2021, I worked out how the app could support most USB webcams, added the code for that, and started planning to abandon a Raspberry Pi-specific fork I’d done (because the ‘picamera’ Python package will scream if you try to install it on not-a-RasPi; plus a few other differences).

Instances for Other Inventories

The app turned out to be flexible enough to be used for managing other kinds of inventory. My spouse has a large collectibles collection documented in an instance of the app. I also used another instance to catalog my fabric stash and sewing patterns. Those happened in September 2021. A good thing came of the collectibles inventory – I was asked to add “edit buttons” to the gallery and reports pages, which I did, for that instance.

Event Sighted Ahead!!

An event was scheduled for April 23, 2022. It would be the first event since Jan 2020. I put my focus in high gear and stuck my head back in a Terminal window sometime around April 6th. I put in over 17 hours of work between April 12 and 23rd. (No data for 6-12 April because I didn’t install Wakatime right away, but I was putting in hours nonetheless)

  • I pulled those “edit buttons” over to the main repository and made them optional.
  • I finished rolling the webcam stuff back into the main repo so I could sunset the RasPi fork
  • I released version 1.1 and 1.2, and created a 1.x maintenance branch for Django 3
  • I upgraded to Django 4 and pulled opencv-python to 4.5.5.x
  • I made a lot of cosmetic changes to the front-end, including standardizing the gallery cards
  • If there’s no camera but the optional “photo contact email” constant has been defined, a modal will display info on how to submit a photo by email
  • I finally deployed an instance on a Raspberry Pi with Apache2 and MySql (previously had only been running on the built-in dev server)
  • I got a bit distracted and fiddled with setting up CI in the repository
  • I then broke that instance by adding a “settings” directory in the project settings folder (oops)
  • It’s okay though – I fixed it!
  • I did dress rehearsals the Saturday and Wednesday prior – brought the RasPi, a configured wifi router, and a Chromebook with me to practice and set it up (and showed it to people)

Event Day went pretty well! Early in the day other staff members learned that it was a quick way to learn where a particular tool was stored. Not a single paper list was consulted during re-pack. We were done and ready to close up an hour and a half after the event closed. In the past that could be 9 or 10pm.

What’s Next?

Inventory Day is next up. Not scheduled yet, but hopefully, they give me some time – there’s a mechanism for reporting inventory checks, but it’s not optimal. I need to build the front-end features that make it possible to scroll through a box’s list of items and click checkboxes for each item seen, then click a “submit” button when done.

At that point, it will be possible, given the availability of multiple notebook computers or tablets, to run multiple teams at once. Each team grabs a box, checks the contents, makes notes, submits the form, repacks the box, marks the physical box as “done”, and grabs another box.

This upcoming inventory day is going to be a bit more complicated, though – we also need to photograph most of the items. We need individual photos, or in the case of multiples, a photo of the multiples all together. These photos are important because they are an integral part of the process of repacking. A visual confirmation that the item in your hand is the item in the search results is needed (some similar items can be found in more than one box due to the need to play Tetris and make everything fit).

The last piece will be to label everything that can be without being obvious to guests, preferably via marker or etching. Because Django is Django, the URLs are RESTful, so any Item can be viewed by appending its ID to the end of the items url.

You Made it This Far, and You Still Want One?

You can git clone it from the Mobiliaire repository on Gitlab and give it a spin. Check the Wiki there for some more detailed setup instructions. If you get stuck, please submit an Issue so I’ll know I need to refine the documentation.

What was that About Woods?

Oh, right, the Woods. With a machine loaded up with Mobiliaire + local (vendored) bootstrap, JQuery, and DataTables libraries + an optional wireless router, your event staff can have access to the inventory system independent of whether the event site has Internet access, and independent of whether there’s even good cell phone signal at the event site. All you need from the event site is a working power outlet to plug your gadgets into. Or a generator. Whatever, I don’t know your life.

The database is incredibly easy to transfer from instance to instance with Django’s ‘loaddata’ and ‘dumpdata’ functions. The resulting files make excellent backups.

Image: “Rhuddlan Castle” by Jeff Buck is marked with CC BY-SA 2.0.

DIY-ing My Way to Better Ventilation

If you scroll back two posts, you’ll find one about COVID-19 risk mitigation strategies. One of the items in that post was DIY CO2 monitoring – based on research that showed that CO2 concentration in an indoor space correlates with infection risk. Since I wrote that post, I’ve actually built two DIY monitors, and they’re being used on a weekly basis to support decisions around when additional ventilation (opening windows, using fans to circulate fresh air) is needed. Note that this measure is in addition to having all participants wear masks 100% of the time and running an inexpensive, ad-hoc air filter in one of the two spaces used.

GIF of monitor screen changes demonstrating the sparkline
a 7-inch screen displays the output of a python script that reads data from CO2 and pressure sensors, and then displays that information on the screen.
CO2 Monitor Script running on a portable Raspberry Pi computer
A bare mini TFT screen with the CO2 Monitor script output displayed

From Humble Beginnings…

I already had both a MagTag and a PyPortal, two small Internet-enabled devices you can program using a specialized version of Python. I started out making just one purchase: a Qwiic/STEMMA compatible CO2 Sensor breakout board plus a cable to connect it. When the sensor and cable arrived, I discovered that, while I could connect to the MagTag, I didn’t have the correct cable to connect the sensor to the PyPortal, which is really what I wanted – for the color screen. Back to the online cart I went for more spending!

Meanwhile…

While I waited for the correct cable to arrive, I gave the sensor a spin using my MagTag, which is presently employed as a small weather widget. Since it was already reporting useful information, why not add a little more, right?

The Adafruit SCD-30 sensor reports CO2 concentration, relative humidity, and ambient temperature. You can get better accuracy from it by regularly feeding it the current atmospheric pressure in millibars. If you have access to a cylinder of calibration gas, you can use that to calibrate it. Otherwise, it has a “self-calibration” feature where the sensor will adjust itself as long as a) you allow it to run continuously and b) you give it access to fresh air at least once every 24 hours. This works because the average concentration of CO2 in fresh outdoor air is approximately 400ppm. The sensor will keep track of the daily low concentration and make adjustments based on those readings after several days of continuous operation.

The first thing I did was add the reported CO2 concentration and ambient temperature to the weather widget display. It was a tight squeeze, but I was able to fit both in at the end of the location name. Ok! I got the hang of using the SCD-30 Python library to fetch information. That’s a great start.

And then, Delivery Day!

Once my correct cable arrived, I moved the sensor over to the PyPortal and began working through other tasks. I hadn’t yet learned how to use CircuitPython to position and display text, so I did that next. By the time I checked my script into a shiny new git repository, it would wait for the sensor to report that a reading was ready, then pull the CO2, humidity, and temperature readings into variables. It would convert the temperature to display in degrees Fahrenheit, and display all three metrics on the screen, in green if below 1000ppm CO2, in yellow if between 1000 and 1500, and in red if above 1500ppm. I added in changing the color of the PyPortal’s neopixel LED a little later on.

Just having a CO2 reading wasn’t enough for me, though! I ordered a pressure sensor and a RTC board, both also Qwiic/STEMMA compatible, and some more cables. I wanted a system that was accurate, that could work without Internet access, and that could support writing sensor readings into a log file with a timestamp for analysis later.

Trouble

As I was nearing completion of my PyPortal script, I discovered an issue: it would boot up just fine if I connected it to my computer (via USB; that’s how the executable scripts are accessed), but would boot up very slowly or not at all if I powered it by an electrical socket adapter (“wall wart”). I did a bunch of testing and consulted with the PyPortal experts on the forums, and finally, the source of the trouble was identified: the PyPortal, by default, supplies 5v to the JST I2C connector. If one is going to run the kind of sensors I was running, the power level needs to be shifted to 3v3 (by cutting a PCB trace and soldering two adjacent pads together). That isn’t something I wanted to do to my PyPortal, so I decided to pivot to another piece of hardware I already had.

Do you like Pi?

Until recently, there were six Raspberry Pi boards in my house, ranging from Model B Rev 2 boards (2012 says hi!) all the way to an 8GB Raspberry Pi 4. Each one is host to one or more locally-running self-hosted services, including RetroPie, Plex, PiHole, WordPress, Grocy, Django, Prometheus, and Grafana.

I ordered a SparkFun Qwiic HAT- an adapter that seats onto a Raspberry Pi’s GPIO pins and has four Qwiic connectors. I decided to use my Portable Pi, a Raspberry Pi 3 + 7-inch official touchscreen housed in a SmartiPi enclosure with separate power input for the screen. When I bought it, I also purchased a Pelican case with customizable foam so it could travel safely. It would be just the thing to bring along with me to the local weekly SCA fighter practice and art night.

a 7-inch screen displays the output of a python script that reads data from CO2 and pressure sensors, and then displays that information on the screen.
CO2 Monitor Script running on a portable Raspberry Pi computer

I dropped a copy of my PyPortal script, installed the Blinka Python library, and got to work modifying the script to work with the 7-inch touchscreen using the Pygame library, which also features touchscreen support. I came up with a script that displays the CO2, temperature, humidity, and pressure, with red/yellow/green color changes at breakpoints defined in the script, and logs everything to a csv file.

Don’t Speak Too Loudly, or Everyone Will be Wanting One

Yep. I talked to people about it. I talked to local SCA people about it. I talked about it way back when I was still working out the script with the PyPortal. “How much would it cost to build one?” they asked. (The answer is, somewhere between $130 and $160, for a build with a color screen, depending on what sizes and types of parts are chosen.)

The local chapter can vote to spend money on such things, and they did. So I ordered some parts. I went with the following configuration:

  • Raspberry Pi Zero W (with Header)
  • 2.8″ mini TFT touchscreen
  • SparkFun Qwiic HAT
  • GPIO splitter (seats on the Raspberry Pi’s GPIO and splits off two sets of connected GPIO pins – one for the touchscreen and one for the Qwiic HAT)
  • Adafruit SCD-30 CO2 sensor breakout with Qwiic/STEMMA ports
  • SparkFun Qwiic LED Stick

I supplied a micro-USB cable for power because I have loads of them around the house. After I complete the configuration, I’ll 3D print an enclosure to hold and protect it all.

Of course, a different screen means a different Python library for the display! So I needed to rework the script again. While I was doing that, I was also asked if it can do audible alarms (it totally can with minimal fuss if you have a Bluetooth speaker handy!) so I added that capability. I wanted to be able to easily import logged data into a MySQL database for data display in Grafana, so I set up a second log type. I added command line flags somewhere in there – you can turn debug on (or off, depending on what the default is), enable Grafana logs (off by default, you need to supply a location name for the log), pass in a local air pressure reading if you don’t have a pressure sensor attached, specify a log filename, and turn regular logging on/off (depending on the default).

Add a Little Spark

GIF of monitor screen changes demonstrating the sparkline

Most recently, I added a sparkline history – the last 18-25 CO2 readings are displayed across the screen between the “PPM” label and the temperature / rH / pressure label. This is not a true graph, as the column heights are freshly calculated every time a new reading is added and the oldest reading is discarded. A “zero” column height is assigned to the lowest number in the set and a “100” column height is assigned to the highest number in the set. The remaining numbers are assigned varying column heights based on their relative position between the high and low numbers, and columns are Unicode characters in the Block Elements group.

The sparkline will show you the trend over the last minute or so.

Eventually, I will build a custom enclosure for it to protect the delicate parts against damage.

Cool, How Can I Get One?

The short answer is: you build it yourself. If you choose the exact same configuration as one of the builds I’ve done so far, you’re in luck – I’ve posted the entire CO2 monitor git repository on my GitLab with an Open Source license. If you choose something different, you may be partly or completely on your own.

If you’re located in Harford or Eastern Baltimore Counties in Maryland, or York or Lancaster Counties in Pennsylvania, I’m available for hire to do custom builds at $75/hr plus the cost of parts and parts shipping. If you just want advice, you can get that for $35/hr.

The graphical output of this script can be piped out to an external display via HDMI. It can be modified to work with only a controller and an array of multi-color LEDs, a tiny OLED screen, or e-paper screens. Add a LiPo battery and a battery management board and you’ve got something very portable you can carry around with you for air quality sampling! Remember when choosing hardware that your chosen configuration is not guaranteed to work with my scripts out of the box until they’ve been tested, and even then, things can and do go wrong (usually it’s fixable and often not terribly expensive).

This is a great project for kids – younger ages will need assistance, but teens will likely be able to do this unassisted. I’m available for tutoring in the same locations as above, but a parent or guardian must be present at the location at all times.

One Last Thing

Remember that Raspberry Pi count I mentioned earlier? Today there are 8 of them in my house. The two new ones are Zero W models, one with headers, one without. One was purchased for this project, the other for an unrelated project).

Editor’s note: as of late 2022/early 2023, my household no longer purchases Raspberry Pi products. We’ve switched to using Libre Computers’ single-board offerings and have also branched out to the Feather line of microboards for things that don’t need a full blown server.

10 Micro-electronics Projects that Aren’t Robotics

There’s more to educational/hobby micro-electronics than building robots.

If you or your kid can’t muster up excitement about robotics, go take a peek at these 10 projects. I’ve included a variety of different projects that do different things, run on different platforms, require different knowledge levels, and have different price points. Some of them also include the opportunity to learn about enclosure fabrication.

1. The Pimoroni Grow

https://learn.pimoroni.com/assembling-grow

This handy widget is a Raspberry Pi “HAT” (that stands for “Hardware-On-Top”). It connects to a Raspberry Pi’s GPIO pins, and is compatible with any Raspberry Pi model that has 40 GPIO pins (so, not the very earliest Pis). It is easy to connect to a Raspberry Pi – you just (carefully) plug it in so that all 40 pins are seated in the Grow’s GPIO socket. You can separate the two boards later if you need to.

The Grow uses connected capacitive touch sensors on custom-designed plant marker sticks to detect the moisture level in potted plant soil, and then gives a visual indication of moisture level for up to 3 sensors.

2. SparkFun OBD-II UART board

https://learn.sparkfun.com/tutorials/obd-ii-uart-hookup-guide

Learn how to read vehicle diagnostics over a serial connection. Those with more experience in micro-electronics should be able to, for example, create a portable version that runs on an Arduino or Raspberry Pi, features a screen and selection options, is rechargeable, and has a custom enclosure.

3. PiHut RasPi TV HAT

https://thepihut.com/blogs/raspberry-pi-tutorials/how-to-stream-digital-tv-with-the-raspberry-pi-tv-hat

Feed digital OTA (broadcast) TV into this board while it’s plugged into a Raspberry Pi and you can stream broadcast TV to other devices on your network.

4. MagTag Pet Feeding Clock

Does your pet tell lies about not having been fed yet? This project is for you!

You can easily program this lightweight smart display to update the date and time your pet was last fed by pushing the left-most button. While it’s not included in the tutorial, a more advanced version of this would give you the ability to track most-recent mealtimes for up to 4 pets (or food plus 3 different medications).

5. Pwnagotchi WiFi Pentester

Test your home network’s wireless security.

Reminder: hack responsibly.

6. Digital-to-Analog Audio Conversion

https://www.hifiberry.com/docs/hardware/up-cycle-your-vintage-audio-system-what-to-do/

Have you found a nice pair of old analog speakers at a yard sale? Give them new life with a Raspberry Pi HAT from HiFiBerry.

While you’re at it, you can use the same Raspberry Pi board to also host a local streaming music server using Jellyfin. Note that you will need to have music files stored locally.

7. Environment Sensor HAT

There’s no specific project tutorial for this one, but similar tutorials are available, and part of the lesson can be adapting to using different hardware. This HAT would be great for an offline local weather conditions display. It even has onboard motion sensing for those of you who live in places where earthquakes are frequent. For even more experienced programmers, how about including weather prediction by data analysis?

9. Binary Clock Soldering Kit

This Binary Clock project is a soldering kit that also presents an opportunity to custom fabricate a case. It comes with a printed circuit board, board components, and a pre-programmed IC, so no programming skills are needed for this one.

10. E-Paper Badge

Show your name (or whatever else you want) on a small e-paper display you can wear. You can add magnets to the back to attach it to your shirt or connect it to a badge lanyard (tip: make that easier by adding a bezel-type frame with lanyard loops).

Where to Next?

Once you learn the basic concepts of connecting peripherals and programming logic, you can take disparate components and make something completely new! There are quite a few hobby electronics suppliers out there these days, with lots of platform and form-factor options (we didn’t even get into soft circuits, which are electronics built into clothing using conductive thread and sew-on components!). Browse those tutorial sections, follow makers on Twitter, and maybe even write a tutorial of your own!